Table of Contents
What is Google Analytics?
Google Analytics provides marketers with advanced tools to understand user behavior, enhance website experience, and complete business goals.
With key insights, you can discover where users are coming from, where they are spending their time, and what drives them to complete an action. Understanding user behavior analytics will help your business produce valuable content to grow in the right direction and recognize patterns within the customer journey.
How It Works
Website owners who want to use Google Analytics must apply for an account with Google then implement the tracking code on their website. The problem is that many people don’t understand how Google Analytics works, or what it does.
Google Analytics is a powerful tool that provides valuable insights into your users’ interests, their journey on your website, and how business goals can be achieved by tweaking marketing efforts in the right direction. A recent study stated that only about 40% of marketers specify their goals in Google Analytics. You should know that user behavior analytics will help you analyze site traffic to increase conversions and ROI. It is an online service that allows website owners to track visitors and page views. It also provides other data, including demographics of visitors, how they found the site, what keywords they used to search for the site, and which pages were viewed.
To understand user behavior with Google Analytics, you first need to understand some key components of the system. These components range from collecting the data, configuring it, processing it, and finally preparing a report. To achieve this, the Google Analytics system uses JavaScript code for collecting information. This code starts working as soon as a user arrives on your website. JavaScript collects information related to the source that brought the user to the website, their browser information, operating system details, and much more.
Importance of Understanding User Behavior
The actions taken by a user on a website determine their behavior. Clicking patterns, scrolling patterns, the specific pages they view, and where they leave or exit the website are crucial elements of user behavior analytics. Tracking user behavior on a website is vital if you want to keep a tab on their interactions with your website.
Source: Business 2 Community
The first step towards analyzing user behavior with Google Analytics is to identify what directs users to your website, then remove the hurdles in their path. To further understand user behavior, you may use on-site surveys and even set up heat maps to see user behavior analytics over time.
Success in the digital marketing space depends on knowing the key factors that motivate the end-user to take specific actions. This is why it is of utmost importance to put proper user behavior tracking tools in place to gain maximum benefit from each user’s journey and then use them to scale up your business.
Studying user behavior via user behavior analytics (UBA) gives you insights into the user experience that you would not otherwise know about. Studies have shown that almost 55% of customers are open to paying more in exchange for a better user experience. In other words, gathering, consolidating, and analyzing user data and understanding their interaction with the website is part of user behavior with Google Analytics.
You can use this data to devise a new strategy and improve the existing user experience. These user behavior analytics answer the fundamental questions of why users visit your website and why they don’t stay long.
It is said that when you want clarity, you should start by focusing on the basics. The basics in business ultimately come from what your customer wants. Therefore, using user behavior analytics is a way to gain insights into what is driving users to your website, knowing their interests along with the factors that confuse them can help identify what is making them leave. Only when you get your hands on these valuable insights can you improve the existing procedures and devise new strategies for your business.
Source: Search Engine Magazine
Google Analytics Features
Providing auto-generated reports for all your marketing campaigns is one of the key features of Google Analytics. This reporting feature provides different types of reports including:
- Advertising Reports – This report shows how well your ads performed to bring in users and their conversion patterns after clicking the ad.
- Audience Reports – This report shows user behavior analytics based on different metrics and interacting patterns of users with marketing campaigns.
- Behavior Reports – With this report, you can learn about the specific path your users took as part of their journey, the content that keeps users engaged, their interaction with your website, and any enhancements you should make to convert visitors.
- Real-Time Reports – If you wish to keep a tab on your website activities or apps in real-time, this report will help.
- Conversion Reports – This user behavior analytics report is a great way to learn about the conversion rates and analyze if your referrals, ads, and other traffic sources have made any progress.
Changes in data over a period are reflected in charts, diagrams, scorecards, and dashboards. With the help of analytic tools, you can understand the hidden aspects of these statistics. Visual data models are always better because of their convenience and ease of readability. Studying the facts and figures can get pretty dull sometimes. On the other hand, studying charts is quicker and lays the foundation for merging and correlating various metrics on a single dashboard.
Google Analytics behavior tracking offers various powerful integrations. You can use Google AdSense, Google Ads, Google Search Console, Data Studio, Survey 360, and Salesforce Marketing Cloud to optimize your overall performance. Although features under Google Analytics are vast, other frequently used features are APIs, data filtering through different funnels, predictive analysis, and conversions.
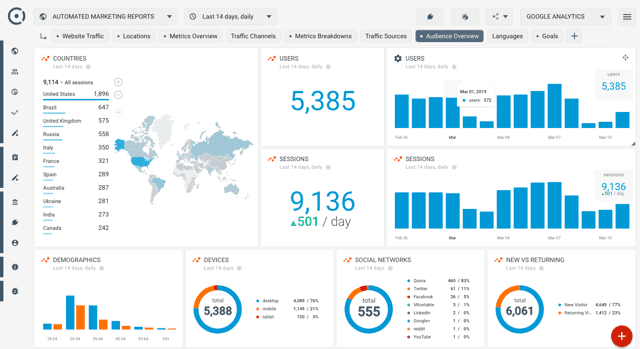
Google Analytics Dashboard
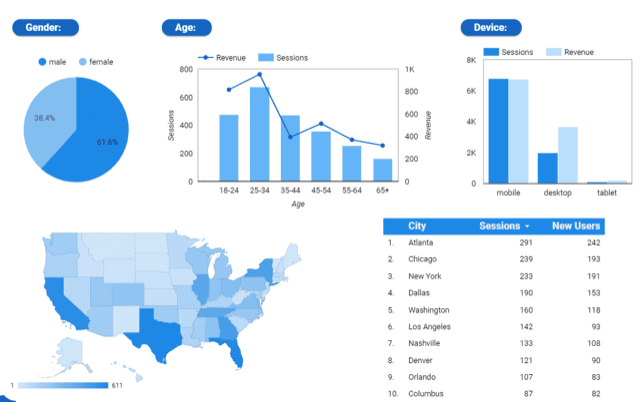
User activity over time in Google Analytics varies and this is why you need reports to understand the analysis. Several user behavior analytics reports can help you understand the navigation patterns of users (on your website), the content that interested them, and the pages they exited.
Source: Octoboard
Here are a few things you’d find in the Google Analytics dashboard:
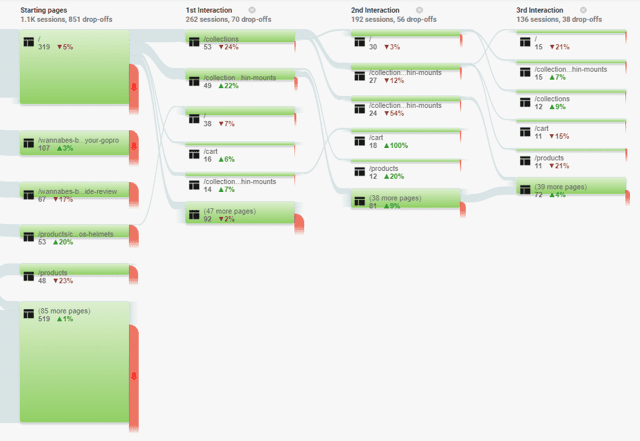
Behavior Flow – Behavior flow shows the aggregate user journeys. Once you understand the flow, you can choose the right areas to place your CTAs (call to action) and direct the path that your users should subsequently follow. By exploring a few settings, you may be able to see traffic sources and the flow of landing pages.
A user behavior analytics report may be essential in interpreting the various influences on user behavior. This behavior may come from using different operating systems or several platforms like Facebook, LinkedIn, Twitter, or the impact of a particular marketing campaign.
Pathway: Behavior > Behavior Flow
User Explorer – This shows the journey of every user. Every user refers to the navigation patterns of each visitor on your website. A unique client ID is used for identifying every user. Although this report may prove helpful, it may contain a lot of information that can be too much to handle. So being specific about the details will help.
Pathway: Audience > User Explorer
Audiences – This feature helps in understanding the nature of a particular kind of audience. You can understand their demographics, traffic sources, devices used, age, and gender. After knowing your audience, you could target a specific niche as per your requirement.
Pathway: Create an audience under Admin > Audience Definitions, then proceed to Audience > Audiences
Site Search – After enabling site search tracking, you can see what people search on your website. For improving conversion rates, conduct a good site search analysis and strategize accordingly.
Pathway: Behavior > Site Search
Traffic Sources – This is one of the most popular user behavior analytics reports. It shows sources your users came from, whether that was organic traffic, referrals, or traffic from social media.
Pathway: Acquisition > All Traffic > Channels
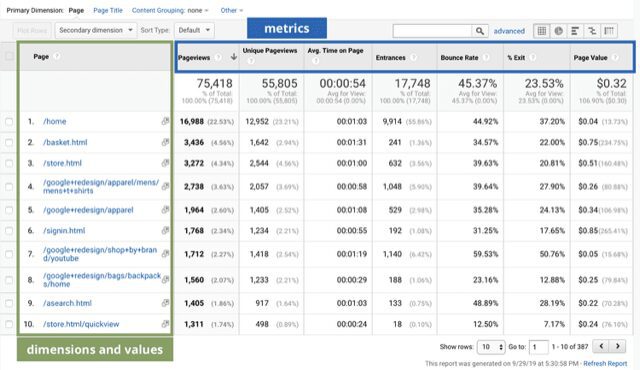
Bounce Rate, Pages/Sessions, Average Session Duration – Bounce rate is a session where only one hit occurs, studies have shown that the average bounce rate is around 55%. The number of pages visited by a user in a single session is called pageviews. The period for which an average session lasts is referred to as the average session duration.
Landing Pages and Exit Pages – In simple words, landing pages are where users land before they reach the main website and exit pages are where they left or exited your website.
Pathway: Behavior > Site Content > Landing Pages/Exit Pages
Vital Metrics
Source: Hotjar
Other than exploring the features mentioned above, some essential metrics that can track user behavior analytics are:
- Users: It provides the number of first-time users and overall users for a particular period.
- Session duration: This refers to the average time a session lasts for users.
- Bounce rate: The rate at which people ‘bounce’ away from your website is referred to as the bounce rate. In other words, the number of people who opened the website but closed it immediately without browsing further makes up the bounce rate.
- Pageviews: Pageviews are the number of times a user viewed a single page during a session.
- Exit rate: The total number of exits constitutes the exit rate for a website or app.
Compare Metrics and Dimensions
After getting your user behavior analytics report, proper interpretation is necessary. These reports contain various metrics and dimensions. Metrics are quantitative attributes used for measurements. For example, page views and average session length. On the other hand, dimensions are qualitative attributes used for describing data. For example, browser type, country, language, and medium.
Some of the most common metrics used in Google Analytics are:
- Acquisition metrics – This metric provides insights as to where the users are and what sources brought them to the website.
- Behavior metrics – This shows people’s behavior once they start engaging with the website.
- Conversion metrics – This feature of user behavior analytics shows the users who finally converted and how much revenue they got due to their conversion.
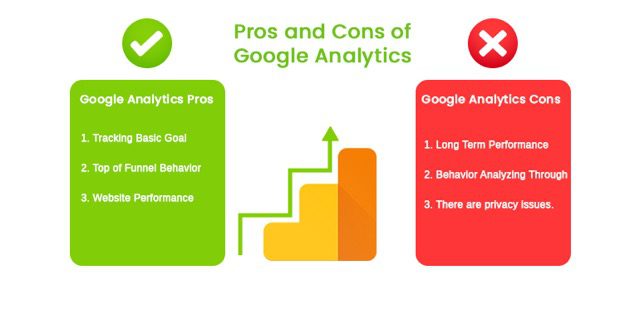
Benefits and Limitations of Google Analytics
Learning about people’s behavior on your website will help you achieve better conversion rates. They also help you get maximum ROI as you can better structure your marketing campaigns in the future. Apart from measuring web traffic, Google Analytics is a tool for business growth and market research. All in all, it helps in improving website effectiveness and increasing conversions.
Although the benefits of using Google Analytics are manifold, there can always be limitations. For example, a high bounce rate may be considered bad, whereas it may not be a negative indicator every single time. If someone opened your website only to find your contact details and contacted you for business, that is not a bad indicator. Instead, it shows that analytics like these can sometimes be misleading if not studied in detail.
Conclusion
Looking at the future of user behavior analytics, Google Analytics 4 is a step ahead. Launched in October 2020, it served as the next generation of Google Analytics. It can be used for a website as well as an app and even both together. This version of analytics is more intelligent because of this Web + App tracking ability. Apart from offering different reports, it can give complete insights into a user’s journey across other platforms and devices as it revolves around the concept of machine learning. All in all, it can automatically give alerts specific to your date trends, eventually helping you get better ROI.
New integrations within the marketing products of Google make it easier to implement learnings and get better ROI for your marketing efforts. If you look at the integration of user behavior analytics with Google Ads, it can measure web and app interactions together, thus providing better guidance to understanding what impacts your marketing efforts make and if you need to devise a new plan with specific ads or CTAs.
You can have a thorough understanding of your users’ journeys too. Whether it is their acquisition, conversion, or retention, this new tool has been re-organized and simplified. You can now access reports based on a specific part of the user’s journey. You can also consider the user expectations, technological changes, and other developments to form your marketing strategies while taking care of the customer’s needs on the go.