Customer retention is the lifeblood of your business, especially if you’re in the services or B2B sector.
It’s so important that industries like IT and insurance tend to retain upward of 80% of all their customers. Even retail enterprises see repeat business from some 63% of their buyers.
However, for some businesses, this is easier said than done. And a lot of it is down to how they measure customer retention. Using the right metrics and correctly deploying them can vastly improve business outcomes.
Read on to learn more about measuring customer retention, why it’s important, and how to interpret the data you collect.
Table of Contents
Why Is Customer Retention Important?
It’s a no-brainer when you think about it. After all, the more revenue you can pull from your existing customers, the less you have to spend on customer acquisition.
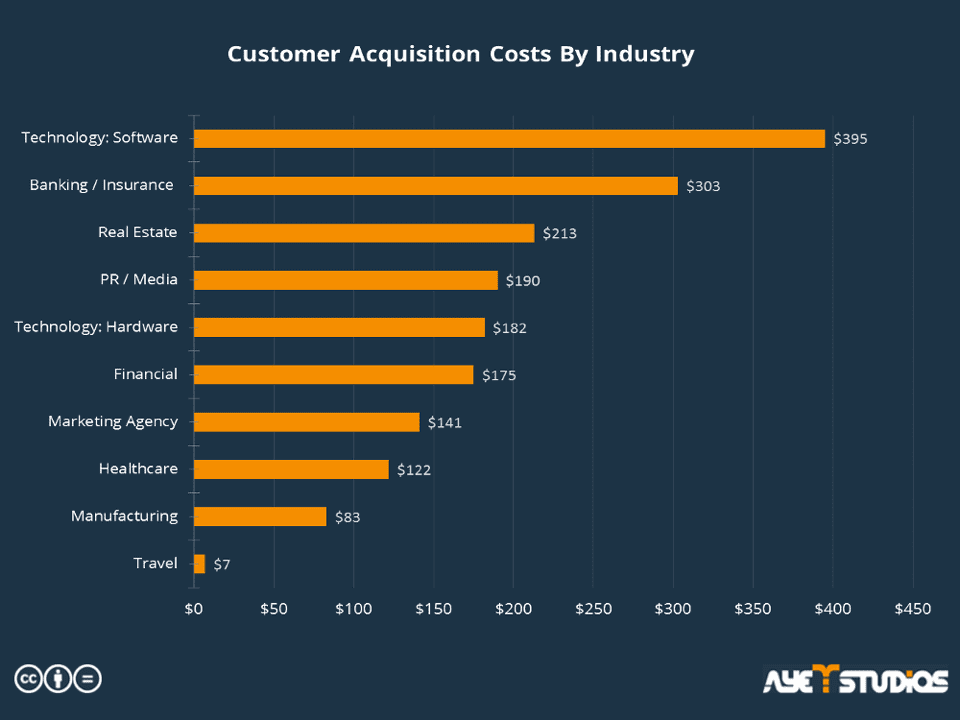
Source: ayeT-Studios
Consider that acquiring new customers can cost you anywhere between 5-10 times more than selling to an existing customer. As the graph above shows, this can add up to nearly $400 depending on the industry. What’s more, they also tend to spend less, with current customers splurging up to 67% more than new ones.
And according to Bain & Company, increasing customer retention by 5% can boost profits by up to 95%.
At that price point, can you afford not to invest in customer retention?
Going about it methodically can further improve your chances of an outstanding return. This is where customer retention metrics come in. It’s important to understand which parts of your customer journey aren’t performing and retention metrics offer you a quantifiable way to identify that.
How to Measure Customer Retention
The first step to measuring customer retention is defining your business goals. What does success look like for you? Increased repeat subscriptions? Improved satisfaction? More upsells? Increased customer lifetime value?
Outline your desired goals and then quantify them, setting a benchmark for your customer success strategy. This will help you choose the right retention metrics for your objectives. Once you have those, you can begin pulling in the necessary data.
The data you need can come in from a number of sources. If you use a CRM system, you should be able to extract most of your data points from there. Analytics tools, such as Google Analytics and Hotjar, can supplement this as well.
What Are Some Good Customer Retention Metrics
There are a host of different metrics that you can track to understand customer behavior. However, tracking the right ones can mean the difference between success and failure. Here’s a list of ten important metrics to get you started.
- Customer Retention Rate (CRR)
Arguably, all your customer retention efforts should be geared towards improving this metric. Expressed as a percentage, CRR measures the number of customers you’ve managed to retain over a period of time.
CRR = [(Number of customers at the end – Number of new customers) / Number of customers at the end] x 100
The CRR metric is the simplest and most effective way of assessing how your customer retention efforts are going. If you have a relatively small customer list, you’re likely to see substantial swings in this metric when one or two of them quit.
The ideal CRR can vary from industry to industry. For SaaS companies, a 90+% retention rate is considered good, whereas D2C retail companies typically average much lower than that.
- Customer Churn Rate
Simply referred to as churn rate, this is a very straightforward customer retention metric that gives you the percentage of customers who leave during a certain timeframe. It’s often used by SaaS and subscription-based businesses, such as streaming platforms and delivery services, that have annual or monthly contracts with customers.
Customer churn rate = (Number of customers who quit / Number of customers at start of period) x 100
For SaaS companies, the ideal churn rate is between 5-7% annually and less than 1% in monthly churn.
- Repeat Purchase Rate
Repeat purchase rate is the percentage of existing customers who buy more than one item during a specific time period. It’s an important customer retention metric to determine brand and product affinity for your customers.
Repeat purchase rate = (Number of customers who made additional purchases / Total number of customers) x 100
20-40% is a decent range to be in when it comes to repeat purchases. Bear in mind that depending on your product, you could see much more fluctuation in this. Seasonal items like skis and beachwear aren’t typically bought all year round.
- Customer Lifetime Value (CLV)
Customer lifetime value is the measurement of the total revenue generated by a customer throughout their association with your brand. This is a key metric for your customer retention and success efforts.
Customer lifetime value = Average purchase value x Average number of purchases x Average customer lifespan
Theoretically, there’s no ceiling for customer lifetime value. In general, the higher your CLV, the better it is. However, a commonly recommended benchmark is for your CLV to be at least three times your customer acquisition cost (CAC). This ensures you’re making a reasonable profit on every customer over and above what you’re spending to acquire them.
- Monthly Recurring Revenue (MRR)
Monthly recurring revenue is a measure of the average revenue you generate per month. As customer retention metrics go, this is a very important one, especially for early-stage brands. It helps you with business and financial planning, helping you assess how quickly you can expand your market or services.
Monthly recurring revenue = Average revenue per account per month x Number of accounts
- Revenue Churn Rate
Revenue churn measures how much your revenue fluctuates. It’s a percentage of how much revenue you’ve lost from your existing customers, such as from a canceled subscription and lower monthly orders. For some businesses, this retention metric might be more important than customer churn rate, especially if they rely on a fairly consistent customer list from month to month.
Revenue churn rate = (Revenue lost over a time period / Recurring revenue over that time period) x 100
Typically, revenue churn, along with recurring revenue, is measured at the end of every month. Tracking it consistently can help you identify trends and make improvements.
- Existing Customer Revenue Growth Rate
This is an important retention metric to measure customer satisfaction with your brand. It’s a percentage of the increase in your existing customers’ spending over a period of time. If you see a significant increase in this rate from quarter to quarter, you know you’re providing good value to your customers.
Existing customer revenue growth rate = [(Current month MRR – Previous month MRR) / Previous month MRR] x 100
- Product Return Rate
Simply put, this is the rate at which products are returned. It’s a good retention metric to gauge customer satisfaction with your products.
Product return rate = (Number of products returned / Total number of products sold) x 100
While a 0% product return rate is obviously ideal, it’s also unrealistic. According to Shopify, the average ecommerce return rate is 20-30%. If your returns consistently exceed this, you should look into the reason behind it.
- Time Between Purchases
This is the average time it takes for customers to buy from you again. It tells you how happy customers are with your product or service and whether they feel the need to experiment with competitors’ products.
To calculate this, you will need to figure out the purchase rate for every single customer. This can vary significantly from a week to a month or more. Next, add up the individual purchase rates for all of your customers and divide that by the total number of repeat customers.
Time between purchases = Sum of individual purchase rates / Total number of repeat customers
- Net Promoter ScoreⓇ (NPS)
This is among the most widely-regarded retention metrics for measuring customer loyalty. Developed in part by Bain & Company, it offers you an indication of how likely your customers are to refer your brand to others.

Source: Net Promoter
The NPS scale ranges from -100 to 100. The higher your score, the higher your customers’ satisfaction with your product or service. You can more or less rely on the fact that a good NPS will lead to improved customer retention.
Customer Retention, Simplified. Outperform Your Competitors With Coalition
Customer retention isn’t hard. Brands that are able to provide consistently high-quality experiences across touchpoints tend to see naturally higher retention rates.
Partner with Coalition Technologies to establish a robust omnichannel outreach program for your customer base. Benefit from the expertise of a proven industry champion to deliver personalized experiences and measurably boost customer retention metrics.
Coalition has generated over half a billion dollars in revenue for over 1,000 customers globally. A multiple award-winning agency, we’re regularly recognized as among the best in the world. Check out some of our work or reach out to us for a personalized consultation and free strategy review.