Google Analytics for Shopify gives you a suite of tools that you can use to fine-tune your marketing efforts. For one thing, it lets you identify your most valuable customers. This will let you adjust the direction and audience of marketing for better results. This is crucial as audience relevance is the most important factor for content effectiveness. Plus, it will give you a bigger picture of your marketing process that Shopify won’t show you upfront. Basically, if you want to get detailed insights into the market, you need to use Google Analytics. In this guide, we’re going to cover everything you need to know to get the most out of the fantastic tools Google offers you.
Table of Contents
- 1 Getting the Most Sales
- 2 Identifying Pages With the Most Traffic
- 3 Finding the Biggest Potential
- 4 Find Where Customers are Dropping Off
- 5 Calculating Lifetime Value Accurately
- 6 Locating Interest
- 7 Checking Bounce Rate
- 8 Conversion Tracking
- 9 Finding Viable Traffic Sources
- 10 Optimizing Business Goals
- 11 Enhanced Tracking
- 12 Wrap-Up
Getting the Most Sales
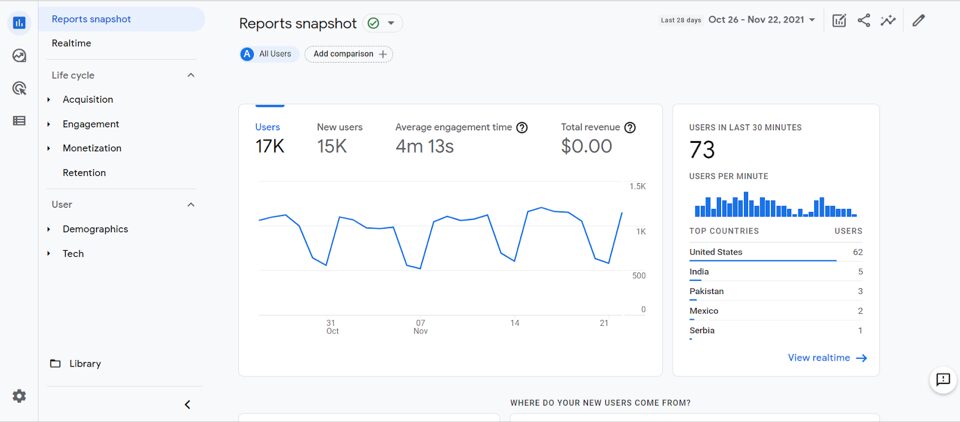
The first part of using Google Analytics for Shopify is getting an Acquisition Report. An acquisition report will give you a broad overview of your marketing efforts. You’ll see how users find their way to their site and are able to break down the info into easy metrics like conversion rate, revenue, and more. This will make it easy to figure out which marketing channels are working and which aren’t.
Google Analytics makes getting your acquisition report easy. Simply start by going to your Google Analytics account. Then go to Acquisition in the left column under Life Cycle. Then click User acquisition, set a date range, and set the segment to First user. Your report will load shortly.
Identifying Pages With the Most Traffic
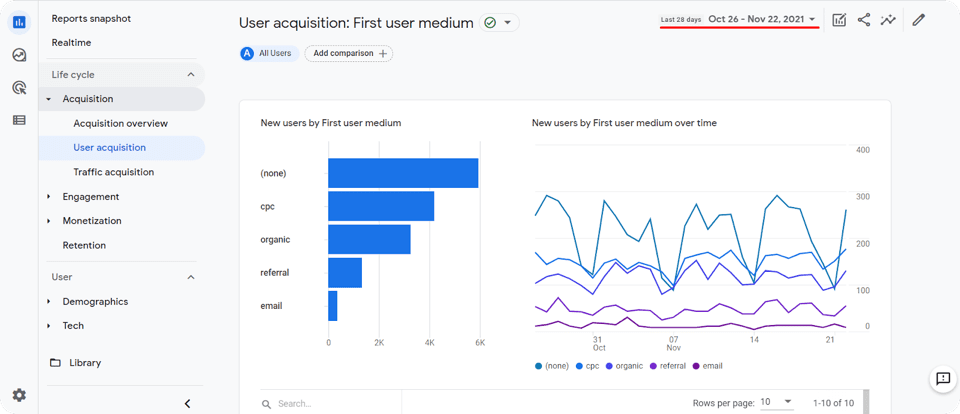
Now that you’ve used Google Analytics for Shopify to figure out how users are first getting to your site, you should identify the pages getting the highest visitors. You can do that with a traffic landing page report. Knowing the pages that get the most visitors is important so you know what pages you should push harder on your marketing channels. If you think that your marketing for those pages is already enough, this data can also let you decide if you want to allocate resources to pages that aren’t so popular. That way you can even out the amount of traffic that you get throughout your site.
Getting the Report
To get the Traffic Landing Page Report in Google Analytics for Shopify, first go to Engagement. Then, navigate to Pages and Screens and click Add Comparison. After that, set a date range for the period of time you want to be included in the report. Then, change page title to page path and change event count from All Events to session_start. Once you’ve set those settings, you get a succinct report of the traffic on your pages. Now you can see what’s popular and what’s not so popular and will be able to adjust marketing accordingly.
Finding the Biggest Potential
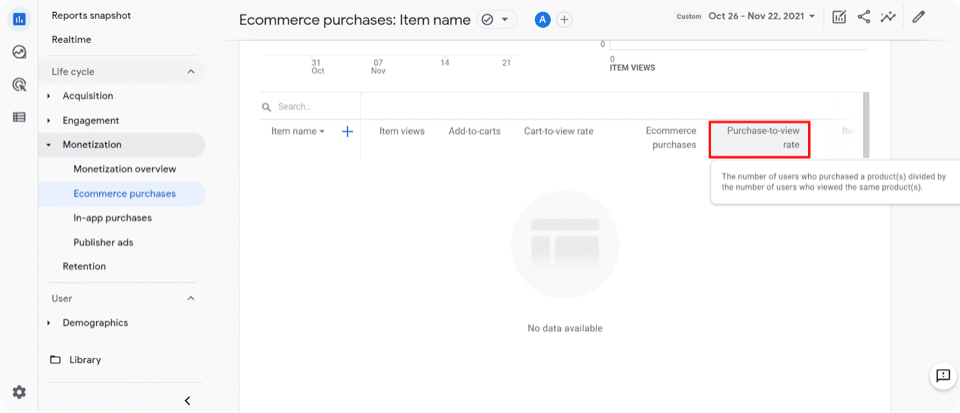
Using Google Analytics for Shopify will also let you see which pages have the most potential for growth with a Purchase-to-View rate report. This report will show how common it is for a user to view a product and then buy it. In other words, even though this page gets fewer visitors, a higher percentage of those visitors are actually buying the product. This is vital to know because you can see which pages will garner you the most success if you invest more resources in them. It can also tell you if what you’re investing in popular pages isn’t effectively paying off.
How to Get the Report
To get your Purchase-to-View Rate Report in Google Analytics for Shopify, start by going to Monetization. Continue by selecting Ecommerce Purchases and from there Add Comparison. Then, you can set a date range for your report. After that, click on Get a Table Organized by Item Name. From there, click on the header and select Purchase-to-view rate. Your report will be given to you in a clean view with percentages clearly marked. Now you know what products people are more interested in buying, and what they look at but don’t end up pulling the trigger on.
Find Where Customers are Dropping Off
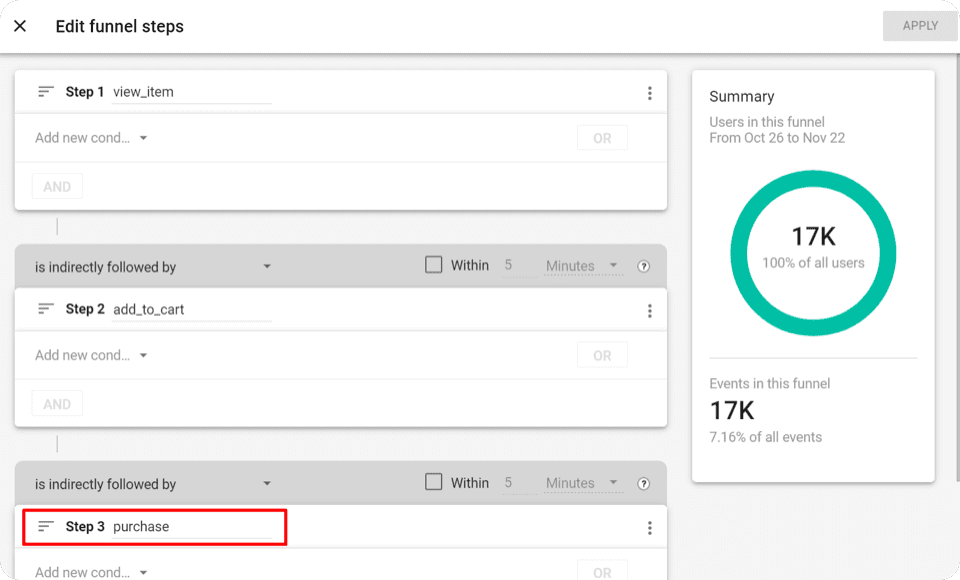
You can find what pages discourage potential customers by using Google Analytics for Shopify as well. You can do this with a Conversion Funnel Visualization Report. This lets you see where customers decide not to check out and what they end up doing instead. These pages aren’t fully hooking users the way you want them to.
Get this report by going to Explore > Funnel Exploration > Remove Steps > click the Pencil Icon > view_item > add_to_cart > purchase.
Funnel Visualizations also let you get many different reports if you mess around with your input query. Feel free to try different searches to see how your site performs on different metrics even if they aren’t useful.
Calculating Lifetime Value Accurately
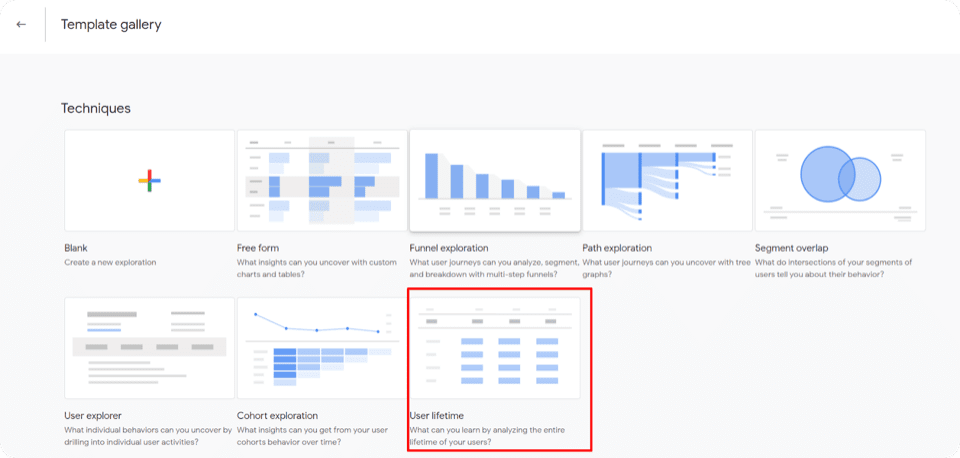
Google Analytics for Shopify has tools that let you calculate the average lifetime value of users. That is, how valuable are customers to your business across their entire time shopping with you. For instance, if someone were to spend $1,200 a year across three years their lifetime value would be $3600. Being able to predict how much value you’ll get from consumers lets you know how many resources to allocate to campaigns for those consumers.
You can do this by going to Explore, then to Template Gallery, and finally to User Lifetime Template. The results will be calculated for you to get an average across multiple user groups.
Locating Interest
Utilizing Google Analytics for Shopify also lets you create a custom user journey report to see which users are most interested in buying your products. This report will instantly visualize the marketing channels driving top-of-funnel events and their relationship to lower-funnel activities. Basically, will your more engaging marketing practices successfully direct people to less successful practices as well? By having this data, you can get a better picture of how your marketing channels work together. Then, you can start combining channels where you see opportunities to bring in more users than before. Combining channels gets better results 82% of buyers will see five pieces of content from you before making a purchase.
Getting the Report
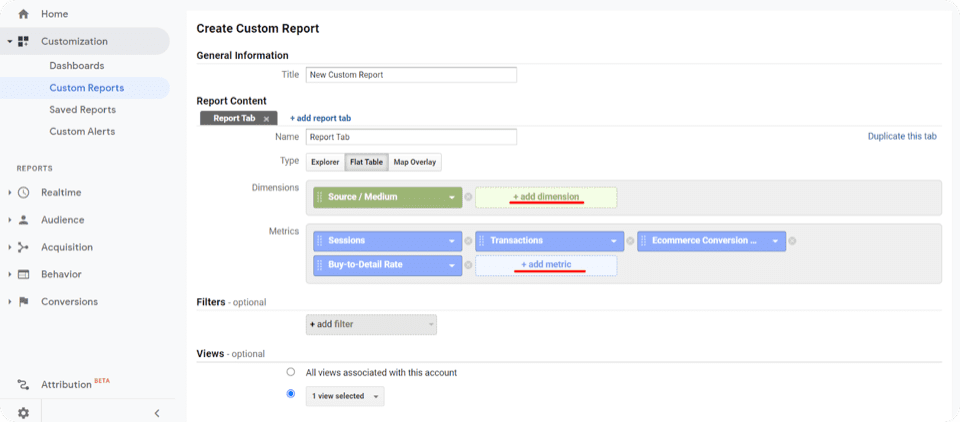
To create the customer User Journey Report in Google Analytics for Shopify, follow these steps:
- Go to Custom Reports
- Select Create New Report
- Title the Report However You’d Like
- Add a Report Tabe
- Name it whatever You Want
- Set Type as a Flat Table
- Set Dimensions as Source/Medium
- Use these metrics: Custom Metrics, Transactions, Sessions, Ecommerce Conversion Rate, Buy-to-detail rate.
When you go to view the results, keep an eye on the percentages rather than raw numbers. A marketing channel doesn’t need to reach a huge audience for it to have a successful conversion rate.
Checking Bounce Rate
A bounce rate refers to factors that cause users to leave your Shopify site. Google Analytics has tools that let you measure bounce rate so you know where your problem areas are. Reducing your bounce rate has a number of key benefits. It will get you higher conversion rates. Your store will then generate more sales. And, visitors will stay with your site for longer periods of time. Go to Sessions and visitors, then to Average Session Duration, and end with Percentage New Sessions to see the ratio of first-time visits. By doing the math for how many sales you actually get, you can see a clear discrepancy where users visit and then leave.
Conversion Tracking
Google Analytics also lets you directly track your Shopify conversion rates. This is one of the segments you’ll keep track of the most since conversion rates are crucial to getting new customers. If you stop getting new customers, you run the risk of stagnating and eventually dying as your existing Shopify customers slowly leave. Google Analytics provides numerous metrics and tools for you to track your conversion rates.
Profits
You can easily track the total amount of money you make. You just want to make sure that you’ve eliminated any operating expenses you have to keep afloat.
Revenue
This is the total you make before expenses. When you know both your total and net income and think that the gap is too high, you can make changes to convert more of your revenue into profit.
Return on Investment (ROI)
An ROI is usually a percentage that lets you know the returns you get for your expenses. Using Google Analytics for Shopify will give you averages, but you’re going to need to implement some other techniques to get exact values. You may even need some accounting expertise. To get an accurate ROI, you should subtract your total investment amount from the total gain (gain meaning profits, not revenue). Then, you divide that number by the cost of your investment. Then you have your total ROI in a percentage form. The higher the percentage, the better the returns.
Revenue Per Visit
Utilizing Google Analytics for Shopify metrics will also show you a report of the average revenue you get per site visit. In other words, how much money do you end up making whenever anyone arrives on your site.
Average Order Value (AOV)
AOV is the average amount a buyer spends when they buy from the store. Google Analytics won’t give you this directly, but you can easily find it by dividing your total revenue by the total number of orders you get.
Finding Viable Traffic Sources
Google Analytics has a number of strategies that can help you monitor potentially viable traffic sources for Shopify. Among the ones you’ll see are Email Marketing Campaigns, Search Engine Optimization (SEO), Direct traffic, Paid Traffic from ads, Referral links, and more. Many people sleep on email campaigns, but you’d be surprised how effective they tend to be. On average, marketing campaigns will have a return rate of $41 for every $1 spent. When you sort through this data in Google Analytics for Shopify, you get a percentage for traffic from each source. Once you know where many of your users are coming from, you can make better decisions on how to focus your marketing campaigns.
Optimizing Business Goals
Once you’ve collected enough data, you can make some optimizations to your store to capitalize on them. To start, you want to have specific goals in mind, such as improving site traffic to a specific page or upping a product’s conversion rate. If you know what improvements to make, you can better shape your action plan with your Google Analytics insights for Shopify.
For broad improvements you can make to a page, you should consider how easy it is to navigate to it, whether the images on it are high-quality and responsive, how engaging the images and copy are, whether product descriptions are too long, etc. If you notice a high bounce rate for a product and find its product description too confusing, shortening it can be a great way to attract more people.
Enhanced Tracking
In addition to the Google Analytics suite, there is also an advanced plugin that can help gauge the user experience directly on your Shopify store. It will keep a measurable track of the ease of use with navigation, cart handling, and other components of the site. If you can’t spot problems with the user experience of your site, this plugin probably will. It will also even monitor all transactions, product clicks, and refunds for better management of store activity. It’s everything you need.
To get it, go to Preferences in your Shopify dashboard and check Enhanced E-commerce. Then go to settings in Google Analytics, click Enable E-commerce Status, and hit the ON button. Now you get automatic, detailed insights to your site.
Wrap-Up
Using Google Analytics for your Shopify store offers a number of key benefits for your marketing approach. You can see what pages get the most traffic, which ones have the most potential, where you drop customers, and so much more. Once you have all these insights, you can bolster your marketing effort by capitalizing on pages with the most potential that currently have little marketing. By combining this with already popular pages you have an opportunity to get huge improvements to your overall marketing results.
For more Ecommerce marketing info and services, explore the rest of Coalition Technologies’ site. With our help, you can radically improve your site’s performance!